




Breaking Down the Countermovement Jump – Part 2
Today’s guest post – the second in a three part series – comes from CSP-FL Sports Science Coordinator and Strength and Conditioning Coach, Yassir Kahook.

This is the second post in a three-part series on evaluating the countermovement jump (CMJ) on force plates. In case you missed it, here is part 1. Today, I’ll discuss why graph shape is king.
Diving deep into an athlete’s metrics will always be valuable for comparing them to peers, tracking progress, and evaluating their engine. But when it comes to programming, the shape of an athlete’s force-time curve is the gold standard.
It’s rare to look at someone’s average braking force, time-to-takeoff, or peak velocity and think, “I’d like this number to get worse.” Of course we want those numbers to improve. The real question is how. That’s where force signature – shape – comes in.
Evaluating how an athlete produces force – and how efficient or inefficient each phase of the jump is – offers powerful insight for targeted programming. This is especially useful with higher-level athletes, where adding pure vertical force production may not be the biggest priority. Becoming more efficient in how they produce that force, though, can make a real difference over a career.
None of this is an argument to ignore the metrics. They matter; analyze them, track them, make sure they’re trending in the right direction. But don’t get lost in the numbers. Shape is what keeps programming honest and specific to the athlete in front of you.
The first step in evaluating shape is sorting curves into archetypes. Below are the seven that show up again and again on the countermovement jump (CMJ) force-time trace, along with what each one tends to say about an athlete’s braking and propulsive qualities – and where the programming priorities usually sit.
1. Early Peak Unimodal
This curve shows one unified peak in force, and that peak happens early in the movement: a clean, single spike rather than a jagged or drawn-out rise.
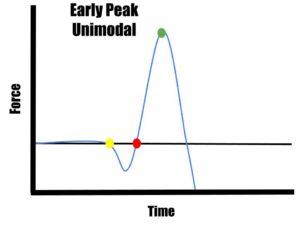
Strengths: Athletes displaying this shape tend to show efficient stretch-shortening cycle (SSC) qualities, along with generally strong braking and propulsive capabilities working together.
Weaknesses/KPIs: The limiting factor here usually isn’t quality, it’s magnitude. The main target is increasing the amplitude of the curve – making it taller and more narrow side to side – along with simply increasing overall output.
2. Late Peak Unimodal
This is still a single, unified peak, but it arrives later in the movement. The rise to peak force is more gradual and gets there closer to takeoff rather than early in the propulsive phase.
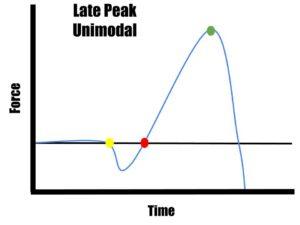
Strengths: Somewhat efficient SSC function, with limbs and center of mass (COM) staying controlled throughout the rep.
Weaknesses: This shape is typically paired with a low braking rate of force development; the athlete isn’t reversing the eccentric phase quickly. That usually shows up as lower overall outputs and a longer time-to-takeoff. Programming here should focus on developing rate of force development in the braking phase specifically, rather than raw strength alone.
3. Early Peak Bimodal
A bimodal curve has two distinct peaks in force rather than one. In the early-peak version, the higher of the two peaks happens early in the movement.

Strengths: High braking rate of force development, and these athletes are usually on the higher end of the output spectrum.
Weaknesses: The second peak is the tell; it signals that efficiency and COM control break down right around peak braking force, and that limb velocities and COM velocity aren’t lining up cleanly. The athlete is strong and fast into the ground, but something in the coordination of the movement is costing them a smooth transition into propulsion.
4. Late Peak Bimodal
Same two-peak signature, but here the higher peak comes later in the movement instead of early.
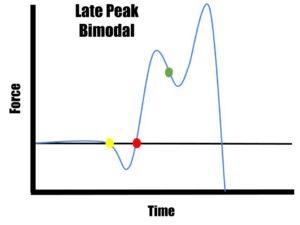
Strengths: Lower braking rate of force development relative to the early-peak bimodal group, and these athletes tend to sit toward the lower end of the output spectrum.
Weaknesses: The underlying issue is the same as the early-peak bimodal: efficiency and COM control breaking down at peak braking, with limb and COM velocities out of sync – but paired with lower overall force capacity. This combination often points to both a coordination issue and a capacity issue that need to be addressed together.
5. Early Peak Plateau
This shape shows one unified peak in force followed by a flatline; the curve spikes, then holds rather than dropping straight back down, with that peak occurring early in the movement.
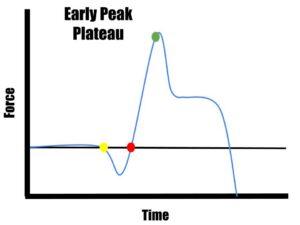
Strengths: High braking rate of force development and generally higher-output athletes, similar to the early peak bimodal group.
Weaknesses: The plateau after the peak is doing the same thing the second bimodal peak was doing: flagging an efficiency and COM control issue right around peak braking, with limb and COM velocities not lined up. The athlete generates force quickly and well, but the body isn’t converting that braking force into a clean, immediate propulsive push.
6. Late Peak Plateau
Here the sequence flips: a flatline in force comes first, followed by a higher peak later in the movement.
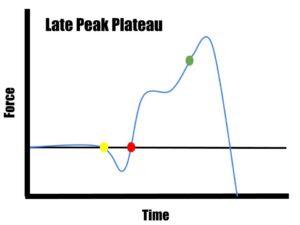
Strengths: Lower braking rate of force development, and these athletes are usually on the lower end of the output spectrum.
Weaknesses: Same underlying pattern as the other plateau and bimodal shapes – efficiency and COM control breaking down at peak braking, limb and COM velocities not synced – but combined with a lower-output profile. This is often the group most in need of a two-pronged approach: build braking capacity while also cleaning up the coordination breakdown.
7. Plateau
The plateau archetype is defined by a long stretch of time around peak force with no single definitive spike. The peak effectively happens across the middle portion of the graph rather than at one clear point.
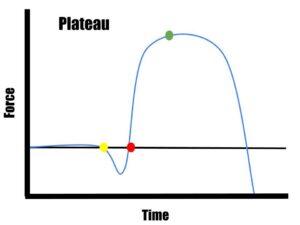
Strengths: Efficient SSC qualities, with generally strong braking and propulsive capabilities.
Weaknesses / KPIs: As with the early peak unimodal shape, the issue here isn’t inefficiency; it’s magnitude and duration. The targets are increasing the amplitude of the curve while decreasing time-to-takeoff (TTT), making the curve taller and more narrow side to side, and increasing output overall.
Why This Matters for Programming
Two athletes can post nearly identical jump height, peak force, or RSI numbers and still need completely different training emphases once you look at how they got there. A late-peak bimodal athlete and an early-peak unimodal athlete might share a vertical jump height on paper, but one needs coordination and timing work around peak braking while the other simply needs more force production layered onto an already-efficient movement pattern.
That’s the real value of building out these archetypes: they turn a single number into a diagnosis. Metrics tell you where an athlete stands. Shape tells you why, and that’s what actually drives what you put in the program next.
Archives: